Relevant Links:
- Find a home you will love on my website
- Market Reports for each CT Gold Coast Town
- Create a custom market report

This... is Fairfield County Connecticut. We are going to explore the current state of the market and the intricacies of buying a home this Fall, so you can decide if this is the right time for you
Hi, my name is Charlie Vinci. I am a Fairfield County CT Realtor, and my realty team and I specialize in helping buyers understand what moving to CT entails and how to relocate to the area.
Let me show you why you might want to buy a Fairfield County home in the Fall, AND a few reasons why you might not.
Table of Contents:
- Introduction
- Closed Sales
- Months of Supply
- Median Days on Market
- Median Sales Price
- Median Percentage of List Price
- What Does it All Mean?
- Wrap-Up
- About the Author
- Relevant Links
Introduction:
The new data just came out this morning, so let's talk about what's going on.
In order to do a good job of evaluating the market, we need enough data to be statistically relevant, and give us a clear picture, so we are going to use all of the Fairfield County Multiple Listing Service data. Let's go…
Hi, if you are new to the site my name is Charlie Vinci and I am a realtor covering the Gold Coast area of Fairfield County Connecticut. There is a ton of information on the area on my website and my YouTube Channel. I highly recommend you take a deeper look into all of the resources to help you make a better real estate decision for you and your family.
Lets jump right into it….
Closed Sales:
There will always be sales of homes, no matter what the market conditions are. Simply put, people need places to raise their family in a safe and secure environment, and no market force is going to trump a family's true need for shelter. No matter how you time it, there will be competition for good homes.
Even in one of the worst real estate crashes in our recent history, one that has no resemblance to our current market metrics by the way, in the worst five years after the 2008 crash, we still sold an average of 976 homes in June.

The annual sales peak typically happens in June or July, and over the last twenty years we typically sell about 1250 homes in the peak month…and that's factoring the worst five years that I previously mentioned.
This year, our peak came in June and we hit 1275 sales. Roughly what we would expect from a historical perspective. This might come as a surprise, so let me add a little more color.
Months of Supply:
Listing prices aren't likely to go down significantly. Here’s why…
While we will likely see a drop in average or median prices. This will happen because the crazy over asking offers from the Spring are subsiding, and homes are beginning to sell closer to their list price. This one factor alone could equate to a ten percent reduction in some price brackets.
While this is great news for buyers, you may not actually notice a ten percent reduction in asking prices. As a buyer, it's going to look and feel a bit different due to limited supply.
This graph shows how long it would take for us to sell off all of the inventory we have, if no new inventory came on. It's essentially a ratio of how fast homes historically sell, in relation to how much inventory we have. It’s our best indicator for a tightening or loosening market.
 But this isn't the whole picture. If you find yourself frustrated about the low inventory, I would like to remind you that we sold 1275 homes in June, which is pretty typical from a historical perspective.
So what's actually happening?
Median Days on Market:
This graph shows the days a home was on the market over the last two decades. As you can see, homes are moving very fast now, and that's the reason that the months of supply are staying so low.
Buyers who move quickly are getting the houses.
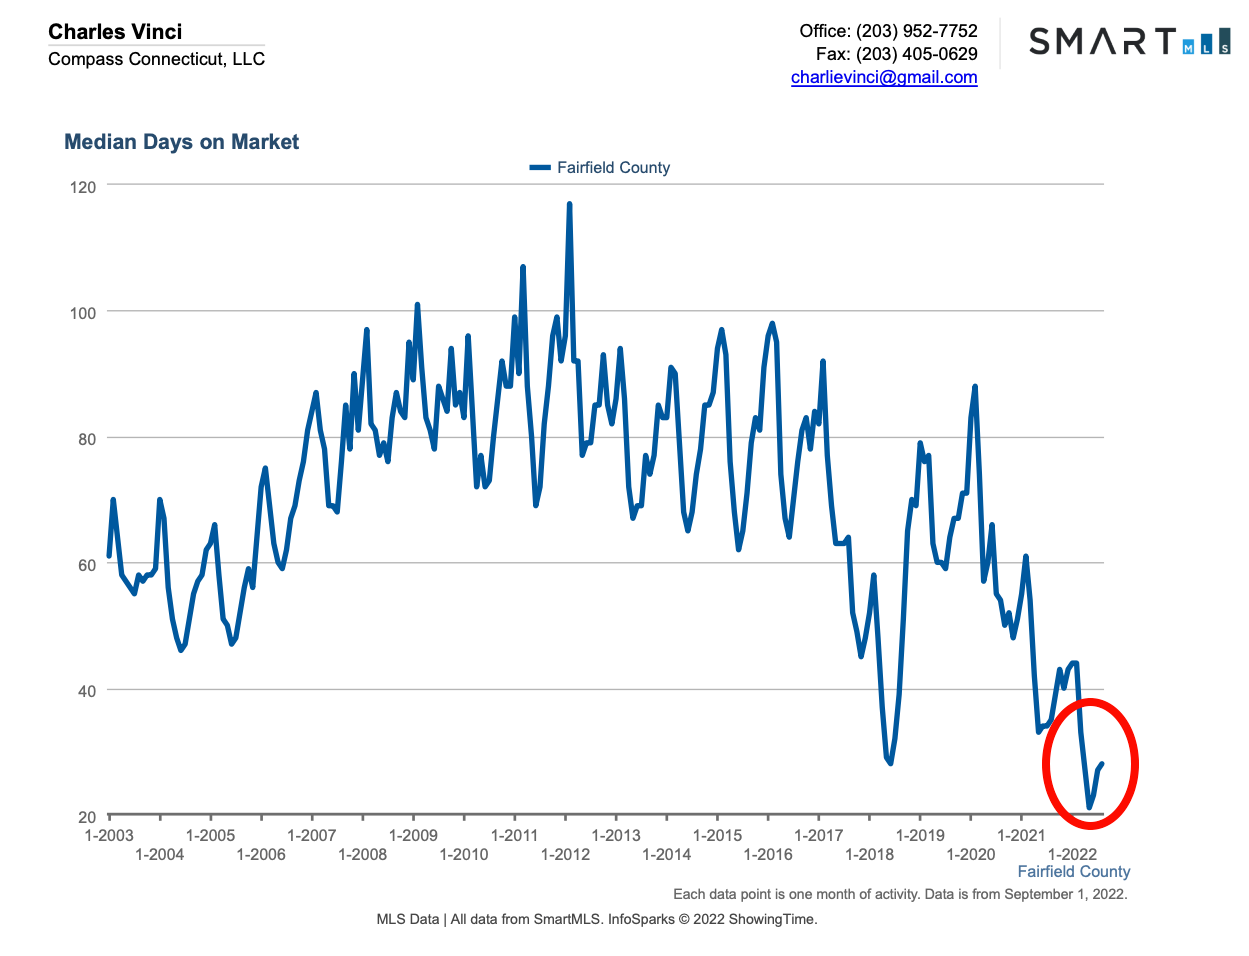 If you find yourself unable to move quickly, it's likely because you are afraid of overpaying. While a good realtor can help with this, I would encourage you to keep an eye on the sold market data as well. You can do this on our website by creating a custom market report, or better yet, email me at charlievinci@gmail.com and I would be happy to create a report for you that delivers the specific sold properties that are similar to what you are looking to purchase.
I am always happy to help you, No strings attached.
By the way, the buyers who win on these homes are typically viewing the property in the first few days on the market, so it’s not so much that there is low inventory, but that you need to be able to move quicker than you would have in the past.
Let's go back to the months of supply graph for a moment.
I wanted to point out that I have done the research over all of the price brackets and this trend is consistent, even our ultra luxury market (over $5MM), which historically had years of supply is way down and still selling much better.

Median Sales Price:
Warning... I am going to be bold here... If you think we are going back to pre-covid pricing, you are probably telling yourself the story you want to hear… a story that the data unfortunately does not support.
Take a look at the median sales price graph for the last two decades.

Do you see how far prices would have to fall? It’s pretty difficult for this to happen with historically low inventory.
While we are talking about price, I thought you would like to know that the peaks generally correlate with the peak sales month of June/July, because higher priced homes sell a bit better in the Spring, and the competition of the Spring market tends to bring higher prices. Historically… If you want a good deal, it's more likely to happen in the Fall and early Winter.
Take a look at the months of supply graph again. Look how long it’s taken us to get here.

Median Percentage of List Price:
One way to see how strong the market is, is to look at how much buyers are paying, relative to the asking price.
Historically, since our last recovery, the average hovered around 97% of the asking price. That shot up quickly after the covid shutdown and by December of 2020, we hit 100% across the county. It has hovered between 99% and 104% since then.

In reality, great homes went way over asking, while less desirable properties sold under asking price.
Even though we are down from our Spring peak of 104% we are still at a median of over 100%. This is obviously an indicator of a strong market. You can take a look at our last market boom on the left side of the graph(between 2003 and 2005), when we peaked around 98.5%. Interestingly, if you remember from our median sales price graph, the median sales price didn't peak until 2008. Nearly three years after the peak list to sale price ratio peaked!

My point is, even if buyers start paying under asking price on average, it could be years before we see a reduction in average sales price, and the sources that I trust are not predicting a recession similar to the historical decline of 2008. Most think this will be a relatively short recession.
What Does it All Mean?:
Considering the low inventory, it’s entirely possible that we can ride this one out without any major reductions in median sales price.
If you are a buyer, yes, inventory is low. But there is no point in getting frustrated about it when you can choose a savvy agent and be better prepared to pull the trigger quickly by staying on top of sold data or relying on your trusted realtor.
Even though the risk is minimal, you should hedge against it by buying for the long term and continuing to own real estate for the duration of your life, even if you trade up. You may win some, you may lose some, but overall history tells us that you will come out ahead.
This isn't like the past real estate busts…
In the mid 80’s bust, interest rates were sky high, I know many people who paid more than fifteen percent, today we aren't even close to that rate.
In the mid 2000s bust, we were giving away loans to people who couldn't afford them. Today, loan requirements are significantly more strict and that isn't happening.
Add to this that we still have a very strong labor market, with relatively low unemployment.
Yes, I know, the stock market isn't doing so well but this often causes people to put money into real estate. Especially in an inflationary period, and especially when rental prices are as high as they are.
Wrap-Up:
If you are thinking about buying or selling, call me, I would like to help you. In the meantime, head over to my site to take a look at the market data, grab our raved about buyers guide or search for homes.
I look forward to hearing from you!
Best,
Fairfield County CT Realtor
203.952.7752
charlievinci@gmail.com
About the Author:
Charlie Vinci, the Founder and Lead Agent of the Charlie Vinci Team has become a mainstay in Connecticut’s real estate market, earning accolades as one of the top 3% of realtors within the state. Fueled by a dedication to the success of his clients and an ever-growing assortment of area-specific resources, the business continues to thrive in the constantly evolving real estate marketplace. An informative YouTube presence has been the primary driver/focus for the team, as it has allowed Charlie to engage directly with his audience and provide a consultative approach to an often ambiguous process. Whether an international client seeking relocation to the US or a local homeowner considering the sale of their property, The Charlie Vinci Team has the market knowledge, resources, and expedient level of service that clients not only desire, but deserve.
Relevant Links:
- Find a home you will love on my website
- Market Reports for each CT Gold Coast Town
- Create a custom market report